What is a market?
Market a group of buyers and sellers of a particular good or service

What is competition?
A Competitive Market is defined as a market in which there are many buyers and sellers so that each has a negligible impact on the market price .In such markets firms will often charge the same price, as any firm that charges less will gain an advantage and all other firms will lower their price to avoid losing market share. On the other hand, any firm that raises it’s price will not be able to sell goods, as customers will buy from the cheaper retailers.
In the text in this section, we will assume that firms are perfectly competitive, which occurs when two conditions are met;
• the goods offered for sale need to be exactly the same (we call this homogenous);
and
• the buyers and sellers must be so numerous that no buyer or seller has influence over the market price. The market for rice is an example of a perfectly competitive market insofar as there are thousands of producers, and millions (if not billions) of customers. Not all markets are perfectly competitive.
Demand
The concept of demand is probably the most important concept in economics, and large bodies of economic work are dedicated to it. We define demand as follows;
Quantity demanded is the amount of a good that buyers are willing and able to buy.In addition to this the main characteristic of demand has been so widely proven so , as to be given the status of a ‘law’;
The ‘Law of Demand’ states that, other things being equal (Ceteris Paribus), the quantity demanded of a good (or service) falls when the price of the good (or service) rises.
In other words, the law of demand states that as price increases (decreases) consumers will purchase less (more) of the specific commodity.
The law of demand lends itself to easy graphical analysis, as all we need to understand are the quantities of a good that people are willing and able to buy at any given price of that good. This information, looking at different price combinations, is used to define the demand schedule for an individual;
Demand schedule a table that shows the relationship between the price of a good and the quantity demanded
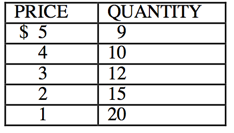
Demand Curve, shows as price level falls the quantity demanded increases. This is a negative relation between price and quantity, hence the negative slope of the demand schedule; as predicted by the law of demand
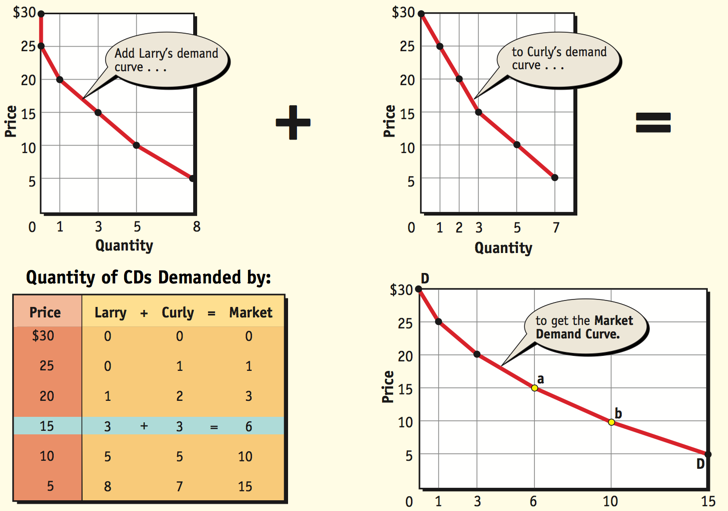
Individual versus market demand – a market demand curve is simply an aggregation of all individual demand curves for a particular commodity.
Factors Affecting the Demand of Commodity
Price of a commodity; movement up and down the stationary demand curve.Price is an important determinant of Demand. Demand for a commodity rises
when it is offered at low price and it falls when the commodity is available at higher price.
Non price determinants of demand; shift to the left (right) of the demand curve is called a decrease (increase) in demand.
The non price determinants of demand are:
1. Income of the consumer
With the increase in income of the consumer his purchasing power increases, he can spend more than what he was spending earlier. Income affects demand for a commodity depending upon, whether a commodity is Inferior, Normal or Essential
Normal Goods
The demand for normal goods rises with the increase in income of the consumer. I.e. income effect is positive. If the income of the consumer decreases then the demand for such goods also decreases.
Inferior Goods
For Inferior Goods Income Effect is negative. So he demands fewer goods of inferior Goods with the increase in income and vice versa.
Essential /Necessities
The goods that are essential for human beings are called necessities. The demand
for such goods does not change with the increase or decrease in income.
Example- Life saving Drugs, Common Salt etc.
2. Price of related goods
Related goods are of two types i.e. Substitute goods and complementary good.
Substitute Goods
Substitute goods are those which can be used in place of each other with equal ease. Example – Pepsi Cola and Coca-Cola. Of the two given goods the demand will be higher for the goods which have comparatively lower price
and vice versa. If the price of Pepsi Cola increases then the demand for Coca Cola will rise.
Complementary goods
Complementary Goods are those goods which are used together for consumption and are incomplete without each other. It means they complete the deficiencies of each other.
Example – Car and Petrol
A fall in the price of one commodity leads to rise in the demand of its
complementary good. Example: – If the price of petrol falls then demand for car will rise.
3. Taste and preferences
Tastes and Preferences of the consumers will also affect the demand of the commodity. A student will demand more of books and pens then utensils because of his preference for the same.
Similarly old television sets were replaced by Plasma or LED T.V.
4. Expectation
Consumers’ expectations concerning future availability or prices of the commodity, affects today’s demand.
5. Number of Consumer
If the population of an area increases then their demand will also increase and they will demand more consumer goods and vice versa.
Changes in demand versus in quantity demanded
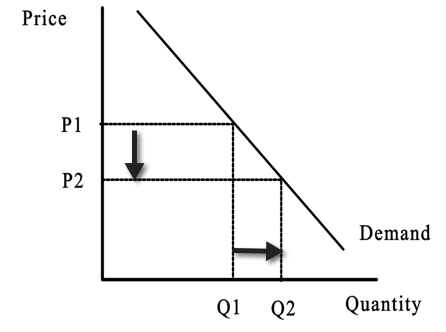
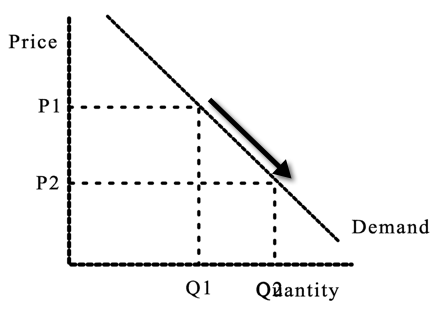
a) Change in quantity demanded is caused by change in the price of the commodity. (Price)
b) Change in quantity demanded is movement along a demand curve.
c) When price decreases from P1 to P2, the quantity demanded increases from Q1 to Q2; when price increases from P2 to P1 the quantity demanded decreases from Q2 to Q1.
a) Change in demand is caused by factors other than price of the commodity. (Non Price)
b) Change in demand is a shift of the demand curve.
c) An increase in demand is shown in the first panel, notice that at each price there is a greater quantity demanded along D2 (the dotted line) than was demanded with D1 (the solid line). The second panel shows a decrease in demand, notice that there is a lower quantity demanded at each price along D2 (the dotted line) than was demanded with D1 (the solid line).

Supply
The concept of supply is as important a concept in economics as demand. We define supply as follow;
Quantity supplied is the amount of a good that sellers are willing and able to sell In addition to this the main characteristic of supply has been so widely proven so as also to be given the status of a ‘law’
The ‘Law of Supply’ states that, other things being equal (Ceteris Paribus), the quantity supplied of a good (or service) rises when the price of the good (or service) rises.
The law of supply, like the law of demand, lends itself to easy graphical analysis, as all we need to understand are the quantities of a good that people are willing and able to sell at any given price of that good. This information, looking at different price combinations, is used to define the supply schedule for an individual;
Supply schedule a table that shows the relationship between the price of a good
and the quantity sold/supplied
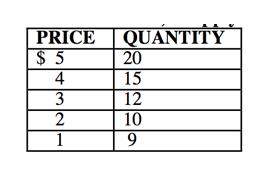
Supply Curve, shows as price level rises the quantity supply increases. This is a positive relation between price and quantity, hence the positive slope of the supply schedule; as predicted by the law of supply.
Individual versus market Supply – a market supply curve is simply an aggregation of all individual supply curves for a particular commodity.

Factors Affecting the Supply of Commodity
Price of a commodity; movement up and down the stationary Supply curve
Price is an important determinant of Supply. Supply for a commodity rises when it is offered at high price and it falls when the commodity is offered at lower price.
Non price determinants of Supply; shift to the left (right) of the Supply curve is called a decrease (increase) in demand. The non price determinants of supply are
1.Input prices The costs faced by producers affect the amount of goods that they are able to sell at any given price
2.Technology Improved technology in general means that more can be done with the same amount of inputs. The result of this is that the effective per unit cost of production decreases, and the supply curve can shift to the right and vice versa.
3.Expectations If a firm expects that the price of its factors of production are to increase in the future, then it may choose to store some of the current production, and sell less to the market now. This could cause the price to rise.
4.Number of sellers In the same way that market demand is additive, so is market supply. As such, the number of sellers on the market will affect the shape of the supply curve. Population of sellers increases so shall the supply.
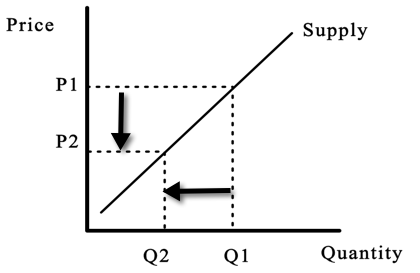
Changes in supply versus in quantity supply
a) Change in quantity supplied is caused by change in the price of the commodity. (Price)
b) Change in quantity supplied is movement along a supply curve
c) An increase in price from P2 to P1 causes an increase in the quantity supplied from Q2 to Q1; a decrease in price from P1to P2 causes a decrease in the quantity supplied from Q1 to Q2.

a) Change in supply is caused by factors other than price of the commodity. (Non Price)
b) Change in supply is a shift of the supply curve.
c) A decrease in supply is shown in the first panel, notice that there is a lower
quantity supplied at each price with S2 (dotted line) than with S1 (solid line). The
second panel shows an increase in supply, notice that there is a larger quantity supplied at each price with S2 (dotted line) than with S1 (solid line).

Market Equilibrium
Market equilibrium occurs where supply equals demand (supply curve intersects demand curve).
An Equilibrium a situation in which the market price has reached the level at which the quantity supplied equals the quantity demanded.
Equilibrium price the price that balances the quantity supplied and the quantity
Equilibrium quantity the quantity supplied and the quantity demanded at the equilibrium.
An equilibrium implies that there is no force that will cause further changes in price, hence quantity exchanged in the market.
The following graphical analysis portrays a market in equilibrium. Where the supply and demand curves intersect, equilibrium price is determined (Pe) and equilibrium quantity is determined (Qe)

Changes in supply and demand in a market result in new equilibrium. The following graphs demonstrate what happens in a market when there are changes in non price determinants of supply and demand.

Movement of the demand curve from D1 (solid line) to D2 (dashed line) is a decrease in demand (as demonstrated in the above graph). Such decreases are caused by a change in a non price determinant of demand (for example, the number of consumers in the market declined or the price of a substitute declined). With a decrease in demand there is a shift of the demand curve to the left along the supply curve, therefore both equilibrium price and quantity decline. If we move from D2 to D1that is called an increase in demand, possibly due to an increase in the price of a substitute good or an increase in the number of consumers in the market. When demand increases both equilibrium price and quantity increase as a result.
Considering the following graph, movement of the supply curve from S1 (solid line) to S2 (dashed line) is an increase in supply. Such increases are caused by a change in a non price determinant (for example, the number of suppliers in the market increased or the cost of capital decreased). With an increase in supply there is a shift of the supply curve to the right along the demand curve, therefore equilibrium price and quantity move in opposite directions (price decreases, quantity increases). If we move from S2 to S1 that is called an decrease in supply, possibly due to an increase in the price of a productive resource (capital) or the number of suppliers decreased. When supply decreases, equilibrium price increases and the quantity decreases as a result.
That is the result of the supply curve moving up along the negatively sloped demand curve (which remains unchanged).

If both the demand curve and supply curve change at the same time the analysis becomes more complicated.
Consider the following graphs:

Notice that the quantity remains the same in both graphs. Therefore, the change in the equilibrium quantity is in determinant and its direction and size depends on the relative strength of the changes between supply and demand. In both cases, the equilibrium price changes. In the first case where demand increases, but supply decreases the equilibrium price increases. In the second panel where demand decreases and supply increases, the equilibrium price decreases.
In the event that demand and supply both increase then price remains the same
(is indeterminant) and quantity increases, and if both decrease then price is
indeterminant and quantity decreases. These results are illustrated in the following diagram.

The graphs show that price remains the same (is indeterminant) but when supply and demand both increase quantity increases to Q2. When both supply and demand decrease quantity decreases to Q2.
ACHIEVING EQUILIBRIUM

The prices at which both demand and supply curves intersect is the equilibrium price.
Equilibrium is the price toward which market activity moves.
If the market price is below equilibrium (Shortage) as quantity demand is greater than quantity supply, the individual decisions of buyers and sellers will eventually push it upward back to the equilibrium.
If the market price is above equilibrium (Surplus) as quantity supply is greater than quantity demand, the individual decisions of buyers and sellers will eventually push it downward back to the equilibrium.
Depending on market conditions, immediately or in the future, price and quantity will move toward equilibrium as buyers and sellers intuitively and logically carry out the laws of demand and supply.
• The ability of the competitive forces of demand and supply to establish a price at
which selling and buying decisions are consistent is called the Rationing Function of Prices.

