1. Price System
Using the tools of demand and supply model we can know look at the question on how goods are allocated in an economic system. The price system is the idea that prices serve as a way to allocate goods to households whenever quantity demanded exceeded quantity supplied. This is also referred to as price rationing. Let us take a closer look at how it works.
A. Price Rationing
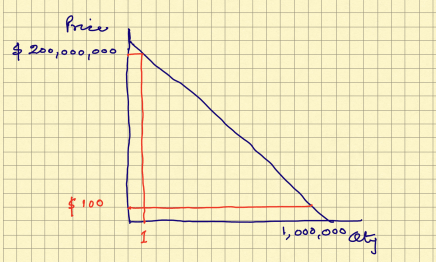
Here’s an intuitive example on how prices can be used to ration demand. Suppose that a newly discovered Vincent Van Gogh painting is being brought before an auction market. (See Figure 1) If the opening bid was at $100, there would be 1,000,000 people who would demand this one of a kind painting at that price. Clearly, there is excess demand. How does the market system determine which of these 1,000,000 bidders will end up with the painting? Well, bidders will start pushing the prices higher. As prices increase, the number of bidders will drop until there is only one bidder left. At $200,000,000 there will be only 1 buyer and that is the person who will get the Picasso painting.
Figure 1: Price rationing and Vincent Van Gogh’s Painting
While price rationing makes intuitive sense in an extreme example like our Vincent Van Gogh painting, it can apply as well to “normal” goods as well. For example, Figure 2 shows the market for pizzas.
Figure 2: Price Rationing and Pizza
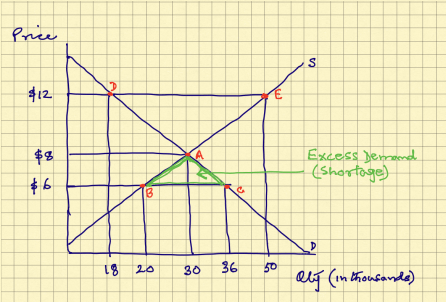
Suppose that the price of pizzas were initially at $6. At that price level the quantity demanded would be 36,000 (Point C) while the quantity supplied would be 20,000 (Point B). There would be shortage of 16,000 pizzas. Which households will get these coveted pizzas? It will be the households who are willing and able to pay the most for the pizzas. Households that really want the pizzas will pay more than $6 and prices will slowly rise. As it does so we move along the market demand curve (From C to A) and the quantity demanded decreases. As prices rise, firms have an incentive to start producing more pizzas and we move along the supply curve (From B to A and the quantity supplied increases. This will continue until the market reaches equilibrium at Point
B. Alternative Rationing Mechanism
After Hurricane Katrina there was a great upsurge in the demand for bottled water. This created a shortage at the prevailing market price. Who would get the bottled water? As you probably guess prices for bottled water drastically increased around New Orleans and those people willing to pay the high prices ($10 a bottle) would have received the water. In cases like these, there are strong compelling sentiments for either the government or firms to step in and intervene to prevent price rationing. These arguments are based on a notion of “fairness”. More specifically
- Price rationing is “unfair” because high prices amounts to price gouging
- Price rationing is “unfair” because only the rich can afford the good
- Price rationing is “unfair” because some goods such as water or gasoline are necessities and households should be able to purchase them at a reasonable
These popular sentiments sometimes lead to a limit on what firms can charge for certain goods. A price ceiling is the maximum price that sellers may charge for a good (oftentimes set by the government). Price ceilings are usually set below the market equilibrium price. Let’s take a look at the workings behind price ceilings.
Figure 3 shows the market for gasoline. Suppose that an oil embargo by OPEC has led to a shard decline in the supply of gasoline. The resulting equilibrium price of gas is now $7 a gallon.
Outraged citizens demand their politicians do something regarding this “price-gouging” and Congress responds by setting a price ceiling of $3 a gallon on gasoline.
Figure 3: Price Ceiling

From Figure 3 we see that the equilibrium price of gasoline is $7 a gallon, at that price quantity consumed would be 75 billion gallons. However, Congress has stepped in and have forced oil companies to charge no more than $3 a gallon. At that price only 40 billion gallons of gasoline will be supplied while 100 billion gallons will be demanded. There is a shortage of 60 billion gallons. Now that we can’t use prices to alleviate shortages, how will the market determine who gets the limited gasoline supply?
- Queuing: Perhaps the simplest rationing mechanism is to have people wait in
Gasoline will thus be allocated to those people who are willing to wait the longest. The problem with queuing is that the time waiting in line is valuable. People could have been working instead of waiting in line, thus there is a significant opportunity cost in queuing. Although they might have paid $3 for gasoline, households actually pay more when you consider opportunity costs.
- Favoured Customers: Another rationing mechanism is that firms may just not sell to the general public, but rather allocate their limited supply to family, friends or their “favorite” customers. In such a system, consumers will start offering side payments to firms in order to become favourite customers and get the gasoline. Although officially they only pay $3 for the gas, households will pay actually more than $3 when we include the side
- Ration Coupons: Another alternative is to introduce ration coupons that entitle households to purchase certain amount of a product in a given period of time. In World War II such ration coupons were popular in addressing the shortages due to wartime needs. However, if trading of coupons is allowed (or if a black market exists), then people could simply buy ration coupons from each other. Those who want gasoline enough would pay to obtain ration
In the end, under all the alternative rationing mechanisms, households will end up paying close to the equilibrium market price.
C. Price Ceiling Example (Super Bowl XX Tickets)
In 1986, the Chicago Bears and the New England Patriots were playing in Super Bowl XX in the 72,000 seat Louisiana Super Dome in New Orleans. It was the first Super Bowl for both teams, and fans in Chicago and Boston were very excited about seeing their teams play. The National Football League (NFL) had to decide how to allocate the tickets and what price they would charge. They evenly divided the tickets between the two teams such that Chicago Bears get 36,000 tickets while the Patriots would also get 36,000 tickets. The NFL did a study and found that because of the high level of excitement in both cities, the NFL could sell out the stadium even if they charged $1000 a ticket. In other words the market clearing equilibrium price for the Super Bowl tickets was $1000. Figure 4 shows the supply and demand curves for this example.
Figure 4: Super Bowl XX Tickets
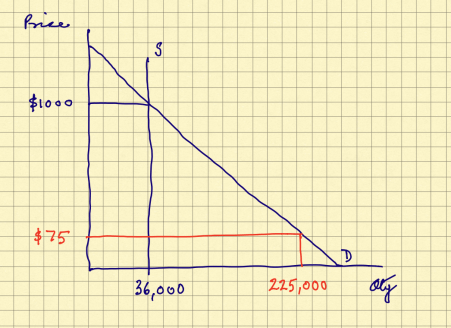
While the NFL could have charged $1000 a ticket, they decided to set a price ceiling and charge not more than $75 a ticket. The reason was that the NFL was concerned about the notion of fairness. If they had charged $1000 a ticket, long time fans would have been outraged by the apparent price gouging by the NFL. Additionally, many fans would also be angered since only rich people would be able to afford the tickets. However, at the price of $75 a ticket the quantity demanded far exceeded the quantity supplied. At $75, 225,000 people wanted tickets for only 36,000 seats. Since the Bears couldn’t use the price system to ration the tickets they had to engage in another mechanism. In the end they decided to employ a ticket lottery, where season ticket holders were entered in a drawing and those lucky enough to be selected were entitled to purchase the ticket for $75.
It turns out the true cost for the lucky fans who got the Super Bowl tickets was much greater than the $75 they actually paid. If you consider the fact that they could have scalped those tickets for $1000, the opportunity cost of going to the game was the $1000 they could have gotten for the ticket.
Key Point: Alternative rationing mechanisms will inevitably not prevent people’s willingness to pay to determine who gets goods in the market.
D. Price System and Allocation of Resources
In addition to determining which households will get the output, the price system can also be used to determine where scarce resources will be employed and what exactly gets produced. Consider a simple example where the price of oil increases due to an increase in demand. As a result of higher prices, profits will increase for oil firms. Higher profits attract capital and more oil drills are constructed to increase oil production. At the same time, oil companies will need to hire more workers to construct and run the oil drills. Higher prices for a good will lead to an increase in production. Resources, such as capital and labour, will be re-allocated from other sectors to produce the good. It is in this way that the price system determines what gets produced in an economy.
E. Price Floors
As opposed to price ceilings, there are times when the government becomes concerned that the equilibrium price of a good is too low. Sometimes the government imposes a minimum price below which households cannot purchase a good. This is called a price floor. Price floors are typically set by the government at a level above the equilibrium price. Typical examples of price floors occur for agricultural goods, where the government promises farmers a minimum price for their product. Another common example is the minimum wage. If you consider labour just like any other good, the minimum wage states that firms cannot hire labour below a certain wage level.
Suppose that in the market for wheat the equilibrium price is $3 a bushel and the quantity produced is 100 million bushels. The government has decided that the price of $3 per bushel is too low to allow wheat farmers to survive. The government then imposes a price floor, which forbids the sale of wheat at a price below $5. At this minimum price level, the quantity supplied would be 150 million bushels, but only 80 million bushels would be demanded, leaving a surplus of 70 million bushels.
Figure 5: Price Floors

2. Economic Efficiency: Consumer and Producer Surplus
We have talked about price floors and price ceilings. Generally, it is believed that such actions by the government to circumvent the price system is not beneficial. Is there any way to support this argument? For that we must first introduce the concept of consumer surplus and producer surplus.
A. Consumer Surplus
When the first Star Wars prequel, “The Phantom Menace” came out in 1999, geeks all across the country waited in lines for days (some for weeks) to see the movie. These fanatics who waited their whole lives to see this movie, would have been willing to pay hundreds of dollars to watch the film (of course they had no idea how bad it was beforehand). Luckily for them, the movie ticket only charged $8.50 for the ticket. The difference between what the geeks were willing to pay for the movie ticket and what they actually paid is known as consumer surplus. Consumer surplus exists because sellers cannot tell what individual households are willing to pay and thus charge one price to all. As another example, McDonald’s sells its Big Mac at the same price to all consumers, even though a customer who hadn’t eaten all day would certainly be willing to pay more for the burger.
Recall that the demand curve shows what individuals are willing to pay at each quantity demanded. Thus the area under the demand curve and above the price line is called consumer surplus.
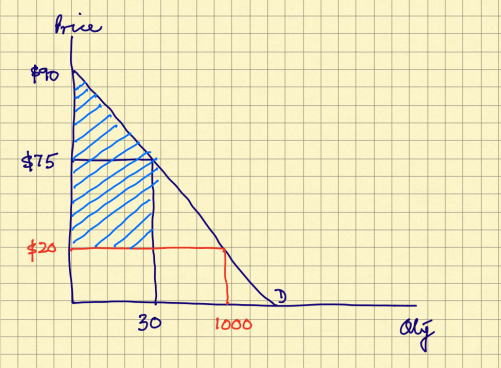
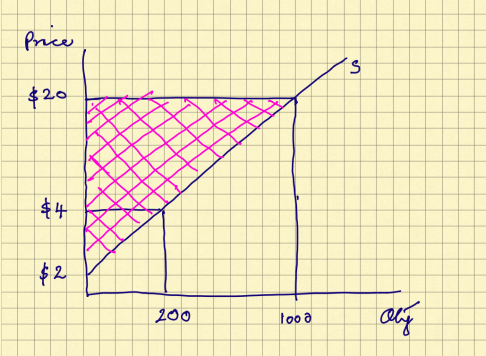
Figure 6 shows the market demand curve for Harry Potter and the Half Blood Prince DVD. The demand curve shows that at a price of $90 for the DVD, there would be no one would purchase the DVD However, if the price drops to $75, 30 DVDs would be sold to some hard core Harry Potter fans. Suppose the equilibrium price is at $20 and equilibrium quantity is 1000 The people who would have paid $75 for the DVDs (but only pay $20) clearly benefit. To measure the total benefit to all consumers, calculate the area of the blue triangle in Figure 6 which represent the consumer surplus. Consumer surplus is equal to (1/2 x $70 x 1000) = $35,000.
Figure 6: Consumer Surplus
B. Producer Surplus
A similar concept exists for firms. Some firms are more efficient than other firms and have lower costs in producing the good. Firms would be willing to supply items as long as the price of the good exceeds the cost of producing it. If the price of the good was below the cost of producing it, the firm will lose money by producing. Firms with low costs have the ability to supply goods when the price is low. The firms that might have been willing to sell their goods at a lower price than what they actually received some surplus. Figure 7 shows the supply curve for the Harry Potter DVDs. Some manufacturers are very efficient and have low costs and can supply the DVDs even if the price was only $4 per DVD. In our example, if the price was $4, 200 DVDs would have been supplied. Again however, there is only one market price in the economy for the DVDs. The equilibrium price is at $20. All the producers who could have supplied it at a lower price than $20 would benefit. This is represented by the red triangle in Figure 7. In this case producer surplus is equal to (1/2 x $18 x 1000) = $9000
Figure 7: Producer Surplus
C. Total Surplus and Deadweight Loss
Total Surplus is the sum of consumer surplus and producer surplus. Total surplus is our measure of efficiency. When total surplus is at its maximum this is known as economic efficiency. Figure 8 show that total surplus is Area A + Area B. Area A is the measure of consumer surplus and Area B the measure of producer surplus. The total area is equal to $44,000. If for some reason the economy is under-producing or an over-producing the good, then there will be inefficiencies and a reduction in economic surplus called deadweight losses.
Figure 8: Total Surplus

Two main sources of inefficiencies are government intervention policies that we have looked at before: (1) Price floors and (2) Price ceilings. Let’s take a look at how inefficiencies will arise in under a price floor.
Price Floor
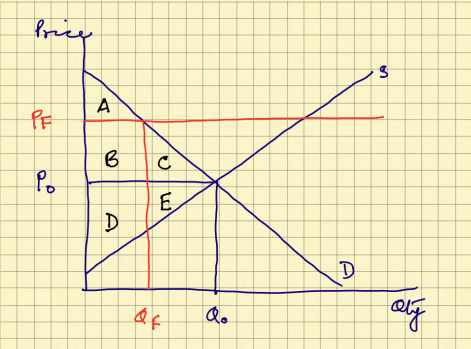
If the price was at equilibrium (P0) then the quantity produced would be at Q0. At the equilibrium price and quantity the consumer surplus will be area above the price but below the demand curve. The consumer surplus is A + B+ C. Producer surplus is just the area above the supply curve but below the price level. This corresponds to areas D + E. Total surplus will be the sum of the two areas. Now consider if the government steps in and imposes a price floor of PF. At this price the quantity purchased would be QF. For consumers, their surplus is only Area A. Because households only consume up to QF, producers will only sell that amount. The producer surplus is the area below the price, above the supply curve and to the left of the quantity sold. (Areas B + D). The total surplus is now A + B + D. Note that the triangle C+E is no longer part of total surplus. This lost surplus leads economists to argue that price floors are inefficient because total surplus is reduced.
| Consumer Surplus Initially | Areas A + B + C |
| Producer Surplus Initially | Areas D + E |
| Total Surplus Initially | Areas A + B + C + D + E |
| Consumer Surplus Under Price Floor | Area A |
| Producer Surplus Under Price Floor | Area B + D |
| Total Surplus Initially | Areas A + B + D |
| Deadweight Loss | Areas C + E |
A similar diagram could have been drawn for price ceilings.
